L.A. County sues Roblox, alleges platform makes it easy for adults to target children February 22, 2026 Los Angeles County filed a civil lawsuit against Roblox, alleging that the platform markets itself as a gaming...
Warner Bros. Discovery reopens talks with Paramount February 20, 2026 Warner Bros. Discovery said Tuesday that it was reopening talks with Paramount Skydance, giving the studio a week...
Warner Bros. Discovery reopens talks with Paramount February 19, 2026 Warner Bros. Discovery said Tuesday that it was reopening talks with Paramount Skydance, giving the studio a week...
CFTC chief sides with prediction markets over state regulators in a high-stakes court case February 19, 2026 The Commodity Futures Trading Commission (CFTC) is stepping in to stop what it calls an “onslaught” of state-level...
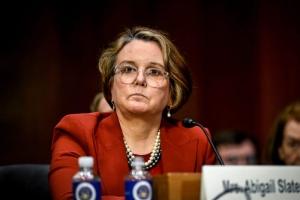
Justice Department’s antitrust chief says she’s leaving, effective immediately February 15, 2026 The head of the Justice Department’s antitrust unit said Thursday she is leaving the role, effective immediately, at...
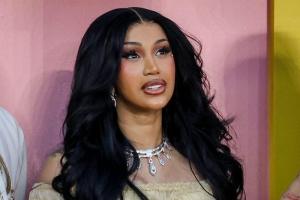
Cardi B’s cameo in Bad Bunny’s Super Bowl halftime show leads to dispute on prediction markets February 13, 2026 CHICAGO — Cardi B was part of Bad Bunny’s Super Bowl halftime show. What she did exactly, well,...
Retail operator of outdoor sportswear pioneer Eddie Bauer files for bankruptcy February 12, 2026 The operator of roughly 180 Eddie Bauer stores across the U.S. and Canada has filed for Chapter 11...
Landmark trial accusing social media companies of addicting children to their platforms begins February 11, 2026 LOS ANGELES — The world’s biggest social media companies face several landmark trials this year that seek to...
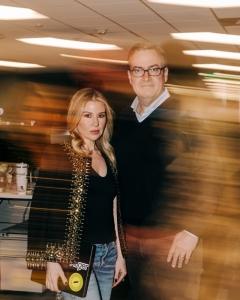
The architect of Amazon’s supply chain on running a startup with your spouse February 5, 2026 For at least two decades, former Amazon executive Dave Clark ended his work week the same way: a...
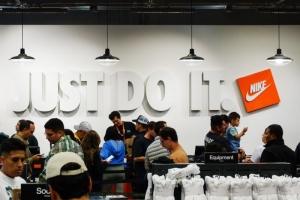
Trump administration alleges Nike discriminated against white workers February 5, 2026 The U.S. Equal Employment Opportunity Commission said Wednesday that it is investigating Nike for allegedly discriminating against white...